Total Harm Risk Metric
Intro
The concept of the Total Harm Risk Metric (THRM) was born when I wanted to create the Gateway Matrix Model. It was obvious that I needed a simple way to evaluate the results from the model. So I devised it and I think that this concept will also work well with existing studies. It offers a single number to directly compare different statics. A number to say it all. The Big Picture.
This is part one of video poster #32 pres ented at the Global Forum on Nicotine (GFN) 2019. The second part is Gateway Matrix Remodeled.
You find the raw poster (without sound) here: <click>
An edited version with audio comment will soon be published on our youtube channel.
The Problem
Whenever we hear about smoking and vaping statistics it’s always something like “The smoking rate has reached a record low, but vaping has increased by alarming xx %, which might re-normalize and be a gateway to smoking”--especially when adolescents are concerned. This apparent inability to scientifically assess the whole statistics seems to be a fathomless fount of fear, uncertainty, and doubt.
A Solution
To remedy this situation, we obviously need some way to condense the data to a simpler, more relatable metric. Which is nothing new for science. It is routinely done with meta analyses and models like SAMMEC that crunch lots of statistical data, to present something like a single “number of premature deaths caused by xxx”, or the “tobacco control scale”, which e.g. allows the ranking of countries by the efforts invested in control measures - as opposed to evaluating only results like smoking rates - and SAMMEC calculated harms.
One possible way would be to identify significant behavioral pattern and assign relative risk factors, like the risks of physical harm for the individual, who keeps to the behavior for the rest of his life. This stipulation is of course a purely theoretical assumption, but it eliminates the uncertainties introduced by wild speculations on possible changes in the future. It should be relative to the most risky behavior (here: regular smoking, which would be at 100 percent).
Total Harm Risk Metric
With an eye to the requirements of a later development of a gateway matrix model, I have identified several distinct behaviors.
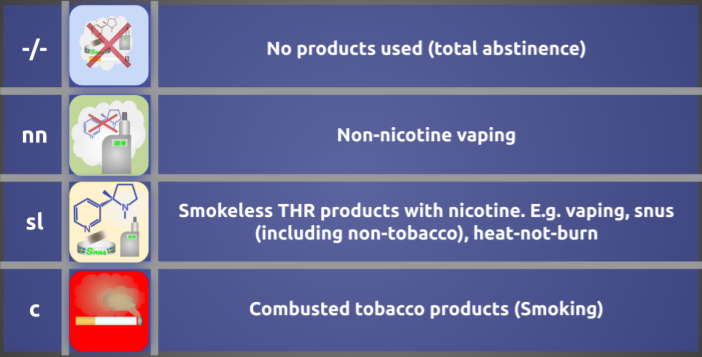
Among them vaping without nicotine is a special case, but for products with nicotine we should differentiate into the following two distinctive usage types: occasional (≤29 days of past 30 days) and regular (daily) use.
On the product side (including tobacco products and vaping products) we also have two groups, i.e. first “low risk” smokeless products and as the second, the “high risk” smoking.
Medium to high risk smokeless products would only be relevant where traditionally available (e.g. Indian gutka). The metric can easily be adapted to factor these in without disturbing the resulting metric number. It also might be sensible for the Scandinavian countries to assess snus separately from other smokeless products.
Basic class of products and usage types
Basic Class of Products

Basic Usage Type
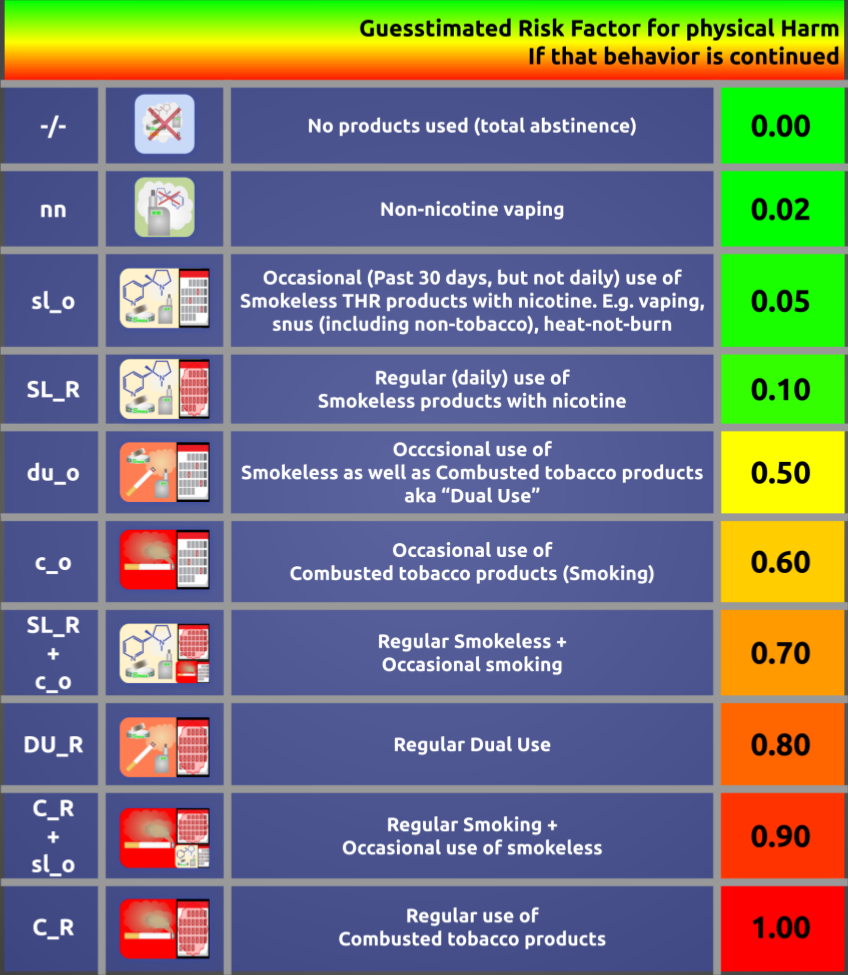
Relevant Combinations and Risks
Risk factor is a guesstimate of long term physical health risks, if the user stays on this path. The numbers are chosen based on a mixture of experience, gut feeling, common sense, scientific estimates, and aesthetic reasons.

The reason for my relatively high guesstimate in smokeless is that I want to also count other smokeless THR products in here, that may have a slightly higher risk than vaping or snus. The ranking of the different combinations is based mainly on the well known self-titration of nicotine users, i.e. the nicotine the users gets from a lower risk source automatically reduces the amount of nicotine that will be consumed from a higher risk source.
https://nzillatron.wordpress.com/2017/05/20/titration-theories/
Example: NYTS
US National Youth Tobacco Survey (CDC)
I know there are many ways to improve on my simplistic approach and probably many more that I didn’t think of, but this example is just meant to demonstrate the concept. I’ll leave the statistical accuracy to professional scientists.
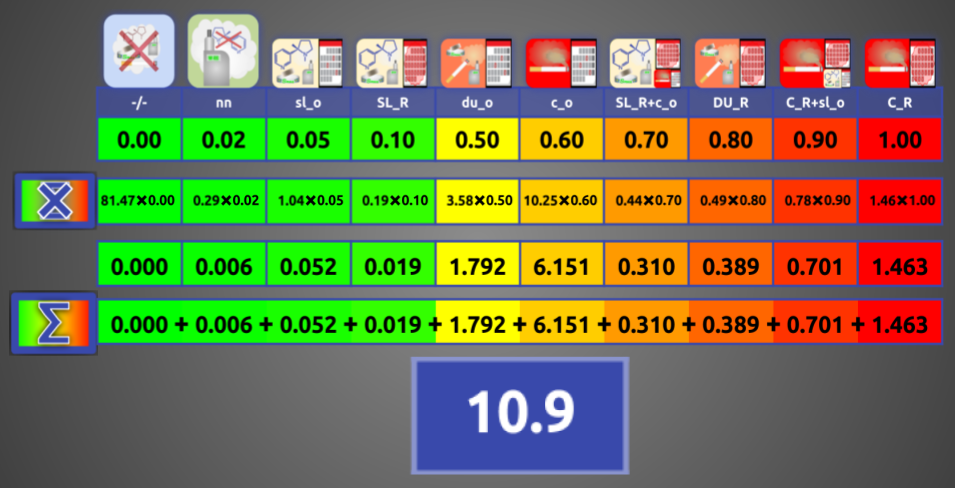
First calculate the percentages in the categories.

Then you multiply the percentage in each category (e.g. 2011) with its risk factor and sum it up. Now you have a single number, the Total Harm Risk Metric. This number represents the average risk of all participant for physical harm compared to 100% if all were smoking.

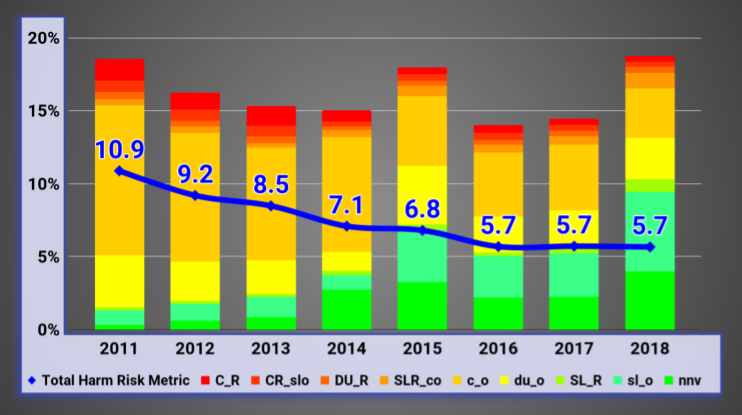
NYTS 2011 - 2018 as a bar chart:

More: Gateway Matrix Remodeled
This was part one of video poster #32 presented at the Global Forum on Nicotine (GFN) 2019. The second part is Gateway Matrix Remodeled.
You find the raw poster (without sound) here: <click>
An edited version with audio comment will soon be published on our youtube channel.
Technical Details
Sources and Calculations
Copies of all the original spreadsheets used for the calculations are available on our Google-drive. You are free to copy them and check my calculations. Downloads work best in "xls" format. A few formulas won't work and some tables are ugly, but they are not relevant for the results. Those are the same.
The summary is in the main sheet:
It contains the links to the sheets for each year, where I calculated the percentages in the categories with all the raw data used:
Each contains these sheets:
- By Category
- A pivot table of the data from "NYTS-subset"
- A very crude guesstimate of the number of participants using NN vaping based on the MTF study ("MTF")
- A row with the absolute numbers
- A row with the percentages copied to the summary
- NYTS-subset
- Direct copies from the original data sheets of the columns I used
- Columns calculating intermediate values
- The main column where I determine the "Category" of the participant
- Descriptions
- Text copied from the NYTS code book for the columns used.
- Explanations for the calculated columns
- Smoking / Smokeless By Category
- Additional calculations, irrelevant for the THRM
- Could be used as guesstimate percentage for inferior surveys to get a number for "daily use", where only P30d was asked.
- MTF
- Data from the "Monitoring the Future" study (2017/2018) that I used to calculate a factor to guesstimate the percentage of people using vaping without nicotine.
Limitations, Simplifications
I know, there are several limitation in my calculations that should be addressed in a real scientific application of this basic concept, but I wanted to keep it as simple as possible. Here are some:
- There is a weight column in the original data which I completely ignored.
- Results might be more accurate if columns with the "last amount of use" were included.
- Calculation of NN-Vaping should be done per participant, as the MTF study shows huge differences in age groups and there is a much higher probability of NN vaping when the participant isn't using any other products. Inversely correlated to the frequency of use of other products.
- The Risk Factors are "pulled out of my hat", but I don't have the means for scientific research to come up with more realistic numbers. Until somebody does, I think they are at least near the right ball park. As long as the same set of numbers is used and they are published, the exact numbers don't matter too much for comparing surveys and what they say about the relative difference of the Total Harm Risk.
Conclusion
This Metric could be a useful tool to present an objective overview of the development over the years, but also to compare the surveys of different regions. Currently journalists, politicians, the public, and even scientists only get a confusing hodgepodge of partial results, all too often cherry-picked for its scaremongering potential. I hope that some of the presently available data will be reprocessed this way and future surveys include it from the beginning.


Ein Gedanke zu „GFN 2019 – THRM“