 This is the companion post for the poster (#112) we presented at the Global Forum on Nicotine (GFN) 2018 in Warsaw. Here you can
- download the poster PDF
- see all presented graphs more conveniently
- find additional scientific information
Inhaltsverzeichnis
Retrospective Survey on Switching Patterns of Experienced Vapers
In 2017 the German Vapers Organization (IG-ED) conducted a survey with over 2.000 participants. Like all Internet surveys it has a selection bias, but here it aids in evaluating empirical data from the most successful vapers.
The main focus of the survey was the transition phase from smoking to vaping. Initial purpose was to provide current smokers with useful information on how the most successful vapers made the switch.
(1) Nicotine Concentration
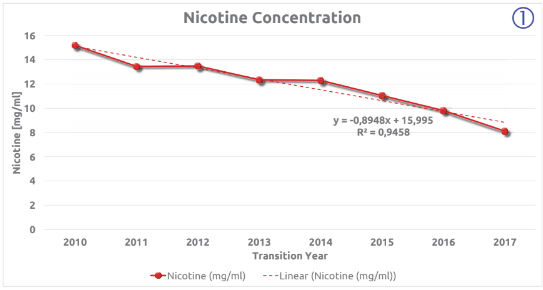
The average nicotine concentration during a successful switch has continuously dropped. Today it is about half of what it was at the beginning. Possible explanations:
- improved devices
- an increasing number of people switching to vaping direct lung (DL) instead of mouth to lung (MTL)
| Transition year | n | Nicotine [mg/ml] |
| 2010 | 65 | 15.2 |
| 2011 | 133 | 13.5 |
| 2012 | 137 | 13.5 |
| 2013 | 129 | 12.3 |
| 2014 | 283 | 12.3 |
| 2015 | 385 | 11.0 |
| 2016 | 447 | 9.8 |
| 2017 | 440 | 8.1 |
| Grand Total | 2019 | 10.8 |
(2) Liquid Consumption

The liquid consumption during the transition phase has grown steadily since 2014. Possible explanations:
- An increasing percentage of DL switchers.
| Year of Transition | n | Liquid [ml] |
| 2010 | 65 | 5.23 |
| 2011 | 133 | 4.85 |
| 2012 | 137 | 4.59 |
| 2013 | 129 | 5.36 |
| 2014 | 283 | 5.29 |
| 2015 | 385 | 5.40 |
| 2016 | 447 | 6.04 |
| 2017 | 440 | 6.57 |
| Grand Total | 2019 | 5.68 |
(3) Nicotine Amount per Day
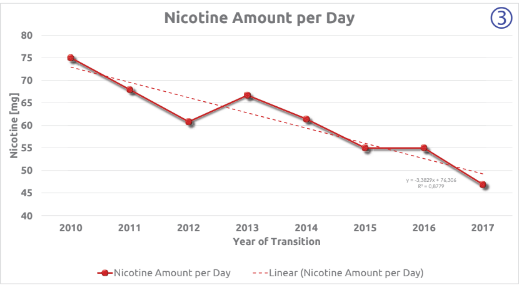
The average total amount of nicotine during the transition phase has fallen over the years from 75 mg per day to 47 mg per day. Possible explanations:
- improved devices
- change in vaping technique (DL vs. MTL)
| Year of Transition | n | Nicotine Amount per Day [mg] |
| 2010 | 65 | 75.0 |
| 2011 | 133 | 67.9 |
| 2012 | 137 | 60.8 |
| 2013 | 129 | 66.7 |
| 2014 | 283 | 61.4 |
| 2015 | 385 | 55.0 |
| 2016 | 447 | 55.0 |
| 2017 | 440 | 46.9 |
| Grand Total | 2019 | 56.8 |
(4) Change in Transition Duration

Plainly declining trend. Average duration of the transition phase has fallen from 10 weeks to less than 4 weeks. Possible explanations:
- better vaping devices
- percentage of people fully intending to switch has grown
| Year of Transition | n | Weeks |
| 2010 | 63 | 9.9 |
| 2011 | 131 | 11.8 |
| 2012 | 132 | 8.4 |
| 2013 | 122 | 8.9 |
| 2014 | 260 | 6.5 |
| 2015 | 363 | 5.7 |
| 2016 | 424 | 3.7 |
| 2017 | 407 | 3.5 |
| Grand Total | 1902 | 5.8 |
(5) Average Duration of Transition Phase

Correlation between the duration of the transition phase and the number of previously smoked cigarettes. The more cigarettes were smoked, the longer the transition phase. Most participants had smoked 11 to 40 cigarettes per day.
| Cigarettes per day | n | Weeks |
| 3 | 16 | 2.8 |
| 8 | 50 | 2.9 |
| 13 | 118 | 4.5 |
| 18 | 386 | 5.4 |
| 25.5 | 765 | 6.6 |
| 35.5 | 339 | 4.7 |
| 45 | 228 | 7.2 |
| Grand Total | 1902 | 5.8 |
Interactive Online Nicotine Calculator
https://ig-ed.org/2018/05/nicotine-calculator/
Data, this calculator is based on:
| Vaping technique | direct lung | mouth to lung | Grand Total | |||||||||
| Cigarettes per day | Nicotine per day [mg] | Nicotine strength [mg/ml] | Liquid [ml] | n | Nicotine per day [mg] | Nicotine strength [mg/ml] | Liquid [ml] | n | Nicotine per day [mg] | Nicotine strength [mg/ml] | Liquid [ml] | n |
| 13 | 31.00 | 4.71 | 6.38 | 28 | 40.58 | 9.24 | 4.27 | 51 | 37.18 | 7.63 | 5.02 | 79 |
| 18 | 41.49 | 6.54 | 7.14 | 70 | 45.19 | 10.67 | 4.52 | 156 | 44.04 | 9.39 | 5.33 | 226 |
| 25.5 | 43.27 | 5.60 | 8.42 | 142 | 58.85 | 12.45 | 4.87 | 297 | 53.81 | 10.23 | 6.02 | 439 |
| 35.5 | 43.42 | 5.33 | 8.69 | 49 | 60.80 | 12.68 | 4.99 | 107 | 55.34 | 10.37 | 6.15 | 156 |
| 45 | 69.34 | 7.56 | 10.11 | 32 | 76.62 | 13.52 | 5.90 | 61 | 74.12 | 11.47 | 7.35 | 93 |
| Grand Total | 44.43 | 5.88 | 8.17 | 321 | 56.22 | 11.92 | 4.86 | 672 | 52.41 | 9.97 | 5.93 | 993 |
Filters:
| Column | Used | Excluded | Reason |
| Cigarettes per day | * | 3(17), 8(51) | Too few participants |
| Vaping technique | * | dl + mtl(331) | Few participants, data not useful |
| Year of Transition | [2015,2016,2017] | 2010(65), 2011(133), 2012(137), 2013(129), 2014(283) | Massive change in hardware after 2014 |
Since the purpose of the nicotine calculator is to calculate a reasonable suggestion for current smokers on what nicotine strength to select when starting, we used only the data from those vapers who switched after 2014. Before that date the available hardware was rather inferior to current products and thus the experience of vapers switching back then isn't applicable for smokers switching today.
(6) Daily Nicotine Amount
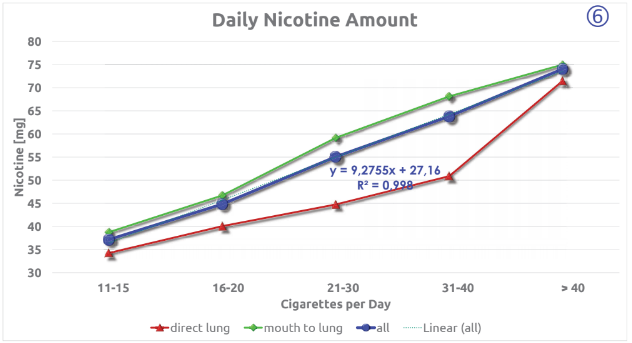
The total amount of nicotine per day correlates almost linearly with the number of previously smoked cigarettes. The more cigarettes someone used to smoke, the more total nicotine per day is necessary for switching. But heavy smokers apparently get less nicotine from a single cigarette than people who smoke less. Thus the slope is less steep than expected. The total amount also depends on the vaping technique. We assume that vaping technique (DL/MTL) has a strong influence on the nicotine kinetics. More studies are necessary. The survey data were used to establish an algorithm for a Nicotine Calculator, which provides reliable recommendations for successful switching (from smoking to vaping).
| Vaping technique | direct lung | mouth to lung | Grand Total | |||
| Cigarettes per Day | n | Nicotine [mg] | n | Nicotine [mg] | n | Nicotine [mg] |
| 13 | 33 | 34.3 | 60 | 38.8 | 93 | 37.2 |
| 18 | 83 | 40.1 | 210 | 46.7 | 293 | 44.8 |
| 25.5 | 166 | 44.8 | 417 | 59.2 | 583 | 55.1 |
| 35.5 | 58 | 50.9 | 174 | 68.1 | 232 | 63.8 |
| 45 | 36 | 71.5 | 98 | 75.0 | 134 | 74.1 |
| Grand Total | 376 | 46.3 | 959 | 58.4 | 1335 | 55.0 |
Filters:
| Column | Used | Excluded | Reason |
| Cigarettes per Day | * | 3(17), 8(51) | Too few participants |
| Vaping technique | * | dl + mtl(331) | Too few participants |
| Year of Transition | [2013, 2014, 2015, 2016, 2017] | 2010(65), 2011(133), 2012(137) | Too few participants and dramatic change in available hardware |
(6a) Nicotine per Cigarette

This calculation clarifies the interesting conclusion that heavier smokers seem to get less nicotine from each cigarette.
| Cigarettes per day | n | Nicotine [mg] | Nicotine/Cigarette [mg] |
| 13 | 135 | 39.4 | 3.0 |
| 18 | 406 | 44.5 | 2.5 |
| 25.5 | 811 | 56.1 | 2.2 |
| 35.5 | 359 | 68.4 | 1.9 |
| 45 | 240 | 82.0 | 1.8 |
| Grand Total | 27.3 | 1951 | 58.0 | 2.1 |
Filters:
| Column | Excluded | Reason |
| Cigarettes per day | 3(17), 8(51) | Too few participants |
(7) Daily Nicotine Amount: Compare Switch Point vs Now
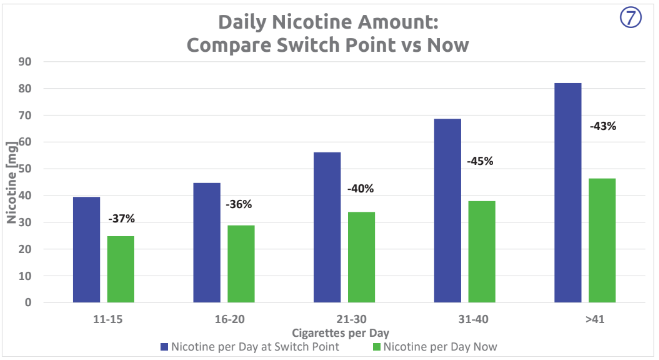
Daily amount of nicotine at switch time compared to the amount at the time of the survey. On average vapers reduced their daily amount of nicotine after switching by 40 % (36 % to 45 %). The data indicate that the participants reduced not just the nicotine concentration over time, but also their total daily amount of nicotine. This contradicts the common claim that switching to vaping just replaces one addiction by another. It also casts doubt on any addiction maintaining property of nicotine.
| Cigarettes per Day | n | Nicotine per Day at Switch point [mg] | Nicotine per Day Now [mg] | % |
| 13 | 135 | 39.4 | 24.8 | -37 |
| 18 | 406 | 44.5 | 28.9 | -35 |
| 25.5 | 811 | 56.1 | 33.8 | -40 |
| 35.5 | 359 | 68.4 | 37.9 | -45 |
| 45 | 240 | 82.0 | 46.4 | -43 |
| Grand Total | 1951 | 58.0 | 34.5 | -40 |
Filters:
| Column | Excluded | Reason |
| Cigarettes per Day | 3(17), 8(51) | Too few participants |
(8) Vaping Technique during Transition Phase
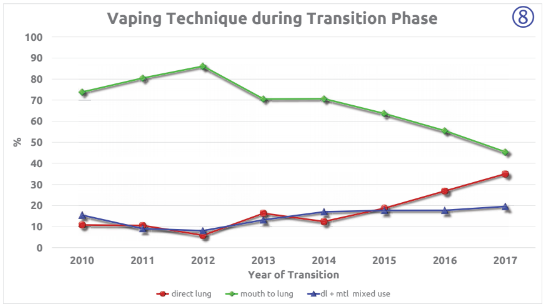
Vaping techniques during the transition phase between 2010 and 2017. Since 2014 we see a significant shift from MTL to DL Possible explanations:
- Development of DL devices for the mass market from 2014
- Increasing share of DL devices in shops
- “Promotion” of cloud chasing by mass media articles
| Year of Transition | direct lung | mouth to lung | dl + mtl | total | % direct lung | % mouth to lung | % dl + mtl |
| 2010 | 7 | 48 | 10 | 65 | 10.8 | 73.8 | 15.4 |
| 2011 | 14 | 107 | 12 | 133 | 10.5 | 80.5 | 9.0 |
| 2012 | 8 | 118 | 11 | 137 | 5.8 | 86.1 | 8.0 |
| 2013 | 21 | 91 | 17 | 129 | 16.3 | 70.5 | 13.2 |
| 2014 | 35 | 200 | 48 | 283 | 12.4 | 70.7 | 17.0 |
| 2015 | 72 | 245 | 68 | 385 | 18.7 | 63.6 | 17.7 |
| 2016 | 120 | 248 | 79 | 447 | 26.8 | 55.5 | 17.7 |
| 2017 | 154 | 200 | 86 | 440 | 35.0 | 45.5 | 19.5 |
| Grand Total | 431 | 1257 | 331 | 2019 | 21.3 | 62.3 | 16.4 |
(9) Nicotine Concentration in Dependence of Vaping Technique
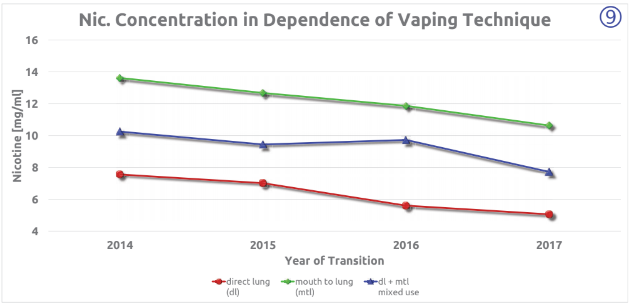
Average nicotine concentration by vaping technique during the transition years from 2014 to 2017. The nicotine concentration in the transition phase has dropped from 2014 to 2017 (DL: 33 %; MTL: 22 %; mixed: 25 %). Possible explanations:
- improved devices (e.g. more power)
| direct lung | dl + mtl | mouth to lung | ||||
| Year of Transition | n | Nicotine [mg/ml] | n | Nicotine [mg/ml] | n | Nicotine [mg/ml] |
| 2014 | 35 | 7.6 | 48 | 10.3 | 200 | 13.6 |
| 2015 | 72 | 7.0 | 68 | 9.4 | 245 | 12.7 |
| 2016 | 120 | 5.6 | 79 | 9.7 | 248 | 11.9 |
| 2017 | 154 | 5.1 | 86 | 7.7 | 200 | 10.6 |
| Grand Total | 381 | 5.8 | 281 | 9.1 | 893 | 12.2 |
Filters:
| Column | Excluded | Reason |
| Year of Transition | 2010(65), 2011(133), 2012(137), 2013(129) | Too few participants |
(10) Decrease in Nicotine Concentration from Switch to Now

The more cigarettes were smoked previously, the more vapers reduced their nicotine concentration over time. Possible explanations:
- heavy smokers more often start as MTL and later switch to DL
- early vapers were mostly heavy smokers and started with inferior devices
| Cigarettes per day | n | Difference in Nicotine Concentration [mg/ml] |
| 13 | 135 | 4.5 |
| 18 | 405 | 5.6 |
| 25.5 | 810 | 6.8 |
| 35.5 | 359 | 7.7 |
| 45 | 240 | 8.4 |
| Grand Total | 1949 | 6.8 |
Filters:
| Column | Excluded | Reason |
| Cigarettes per day | 3(17), 8(51) | Too few participants |
Conclusion
Results from over 2.000 participants show that the total amount of nicotine per day is strongly correlated with the number of cigarettes smoked and the vaping technique. Based on this data, we developed an online nicotine calculator to better understand the switch from smoking to vaping.
The daily nicotine intake is not directly scaleable by the number of cigarettes smoked. Heavy smokers get less nicotine from each cigarette than regular smokers. We also found that vapers tend to significantly reduce their initial daily nicotine intake after switching.


2 Gedanken zu „Global Forum on Nicotine (GFN) 2018 Poster“
Vielen Dank für diese Infos. Für mich ist das eine gute Orientierungshilfe bezügl. durchschnittlichem Nikotinbedarf, Umstiegsdauer, usw . Ich bin gerade beim Umstieg – von 40+ Zigaretten (43 Jahre lang) zu aktuell zwischen 5-7 – nach einigen Wochen dampfen. Ich hatte allerdings massive Probleme mit den Liquids (zu süss, scharf, Gefühl von Belag im Rachen, zu wenig Nikotin, 4 mg/ml, weil meine Lunge bei mehr als max. 5 mg/ml streikt). Inzwischen habe ich zumindest 1 Liquid gefunden und seither geht’s voran… Als Österreicherin gibt’s auch noch ein paar andere Probleme (Versandhandelverbot). Ich bin Mitglied beim österreichischen Dampferclub, OECD (nachdem ich einen entsprechenden Hinweis von Philgood in einem seiner Videos sah).